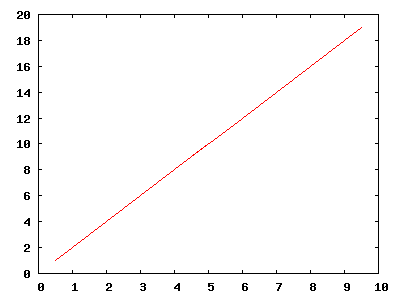
I just figured out how to plot the numerical derivative of a data set in GNUPLOT.
Suppose we have a test data set like this:
0   0
1   1
2   4
4   16
5   25
6   36
9   81
10  100
Yes, this is just the function \(y=x^2\), but unevenly sampled, to demonstrate that the method I use works even in this case.
To plot the derivative of this data set (assumed to reside in the file test.dat), one can use the following simple script:
x0=NaN
y0=NaN
plot 'test.dat' using (dx=$1-x0,x0=$1,$1-dx/2):(dy=$2-y0,y0=$2,dy/dx) w l notitle
The code should be self-explanatory. The trick is that current and recent versions of GNUPLOT allow variable assignments inside the plot command. The result is precisely what we would hope to see, that is, the plot of \(y'=dx^2/dx=2x\):


