
Photoplethysmography (PPG) is a method to assess blood flow and other clinical parameters by measuring light absorption and reflection of the skin. Remote photoplethysmography (rPPG), in particular, uses a camera, such as a webcam, for this purpose. Surprisingly, it actually works.
Below is a simple application that demonstrates this capability. What may be remarkable is that this application uses only the native capabilities of the Web browser, and requires well under 400 lines of code, HTML + CSS + JavaScript. This little implementation is entirely self-contained, without relying on any third-party code or library.
Needless to say, you need a Web cam for the app to work, and you must grant permission to use the camera when the browser asks for it.
The software likely works in all recent Chrome-derived browsers and the latest Firefox; may fail with other browsers. Note that this is a technology demonstration, not a clinical tool. The measurements are uncalibrated, "proof-of-concept", not necessarily accurate. No information is transmitted over the Internet: the measurement and its evaluation take place entirely within your Web browser's context on your own local device.
Over the years, I have had several projects that remained unfinished, undeployed. The reasons varied: business decisions, technical merit, you name it. But darn it, the work I have done on at least some of these projects makes me feel proud, their ultimate lack of success notwithstanding.
This silly little project is an analog clock, with the hours arranged in alphabetic order. Available in four languages.


I came across an interesting data set: an illustration of how housing prices vary relative to disposable income in OECD countries. I wanted to create a map that shows this data set visually. To be sure, there are some online tools that do this, and I also learned how to do it using the R language. But, I figured, it should be possible to build a simple interactive tool that suits my needs.
Well, I did just that, with the help, this time around, of the Grok-2 AI. (Yes, I know, I know... But it works.) Here's another example, a map of GDP per capita, latest (as of early 2025) available values around the world:
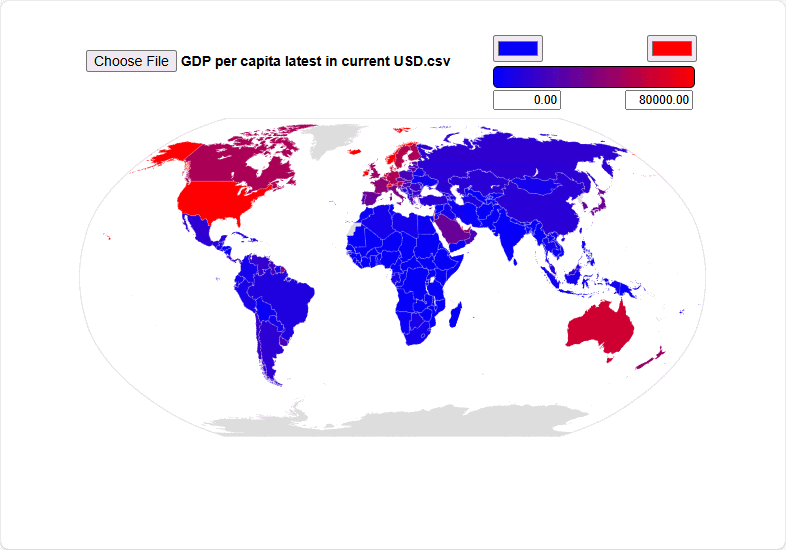
The tool is easy to use: Just click Choose File and upload a CSV (comma-separate values) containing rows with country names (most commonly used names are accepted) and values. You can adjust the range of colors and also the values associated with them; values outside the range will be colored the same.

